The expansion of rubber and other cash crops has caused massive forest loss and fragmentation in Xishuangbanna, particularly in the last 20 years. Rubber occupied 22% of the area by 2010, reducing lowland forest to scattered fragments. The rubber price has declined steeply since 2011, but consequences for forest biodiversity have not previously been explored.
Researchers from Xishuangbanna Tropical Botanical Garden (XTBG) used a new approach for high-resolution vegetation mapping that combines phenological information with object-based classification to produce land-use maps for 2002, 2010, 2014, and 2018.
The research result has been published online in Regional Environmental Change.
The researchers attempted to see whether forest loss had declined following the recent (2011) collapse of the rubber price and where the remaining forest was and how fragmented it was. They further wanted to see what priorities should be for forest conservation in Xishuangbanna.
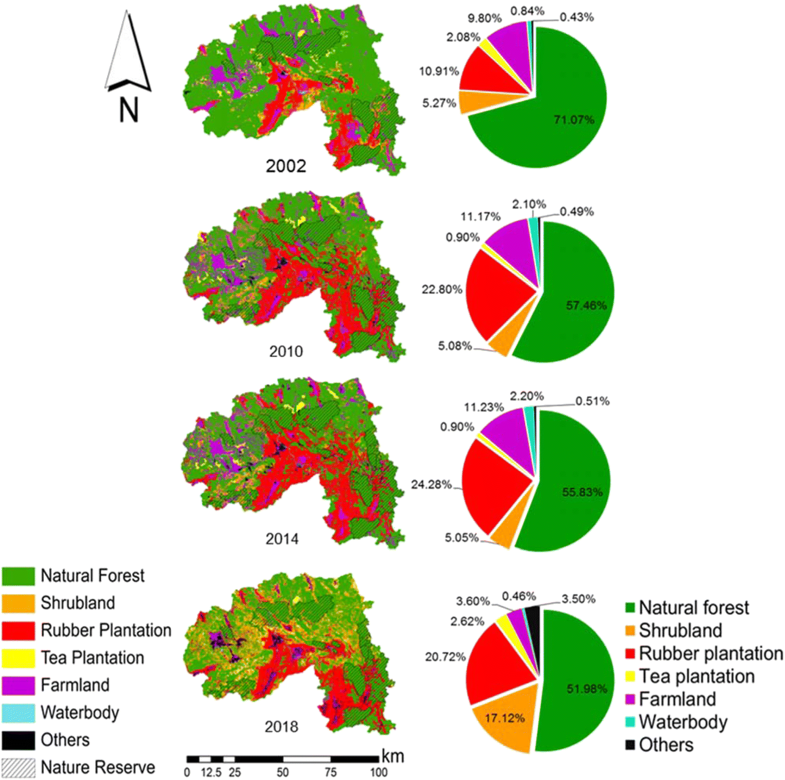
They found that forest cover declined continuously during 2002-2018, from 71 to 52% of the land area, while rubber increased from 11 to 24% by 2014, before declining to 21% by 2018. The increased area of rubber during 2002–2014 was mostly at the expense of forest, shrubland, and farmland.
The spatial analysis of land-use change in Xishuangbanna revealed both good news and bad news for biodiversity conservation. The good news was that the expansion of rubber plantations that drove rapid deforestation below 900 m for nearly two decades has ended.
The bad news was that deforestation continues; indeed, it has accelerated since 2014, although it is still slower than during the 2002–2010 rubber boom.
Since biodiversity in Xishuangbanna’s forests is a national priority, the researchers proposed priorities for forest conservation.
“We recommend that all the largest patches are preserved, plus smaller patches selected for their biota, and that forest restoration is used to restore connectivity and buffer small patches of high conservation value”, said principal investigator of the study.

Maps and percentages for each land use in Xishuangbanna in 2002, 2010, 2014, and 2018.
(Image by ZHANG Jiaqi)

